Best of Breed? Junior Controls Long Life Gold Mine(s) and Rock Solid Balance Sheet
Nov 08

Richmont Mines (NYSEMKT: RIC) released its Q3 earnings November 6th with another respectable performance. Adjusted net earnings were $4.4M ($0.10 per share) and operating cash flow was $8.5M.
During the course of the year Richmont raised its production guidance twice. The first 9 months of 2014 have been better than most full years, both financially and operationally. After costs ballooned in 2012 and 2013, Richmont shook-up the boardroom, invested in new equipment, adjusted its mining methods, and gave up on zones that proved to be unreliable.
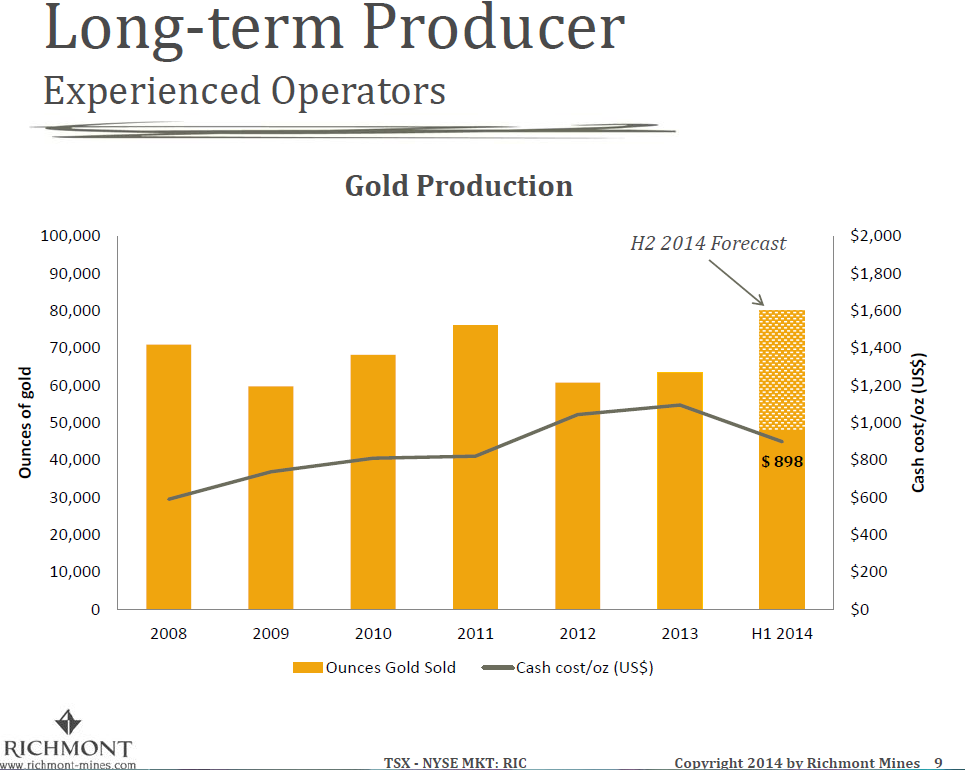
Those decisions are paying off… year to date production costs are down 15% (20% in dollar terms) to $948 Canadian and $866 US.
Cash costs during Q3 were $876CDN ($804US).
As you can see below, between 2008 and 2013 Richmont’s gold production averaged 60,000 to 70,000 ounces per year. Having produced 71,354 ounces through Q3, it’s perfectly positioned to meet or exceed this year’s goal of 85,000 to 90,000 ounces.
Year to date, Richmont has generated $24.2M operating cash flow, or $0.55 per share.
In other words, investors are paying less than 5-times operating cash flow (on just 9 months worth of earnings) to own a piece of Richmont Mines. Assuming it makes money during Q4, the valuation would look even more attractive. Compared to its peer group, shares of RIC have outperformed, during what has been a historically ugly time for mining stocks. That tells me the market has taken notice of Richmont’s turnaround; investors are betting production growth and profitability will continue to improve going forward.
According to its most recent filing, Richmont’s balance sheet is rock solid:
CASH = $38M
Debt = $5.8M
How and where does Richmont do it?
Known for its expertise in underground mining, Richmont has been exploring, developing, and producing gold for more than 20 years. It operates from three mine sites located in Quebec and Ontario. Ore is processed through one of two company owned mills, each having its own name.
1) “Camflo”, rated for 1,200 tpd (tonnes per day), processes ore from the Beaufor and Monique mines located roughly 50 kilometers away.
2) “Kremzar”, rated for 850 tpd, processes ore from the Island gold mine located onsite.
Of all the mines and properties, Richmont owns 14, Island Gold is the celebrity that receives a majority of analyst / investor attention.
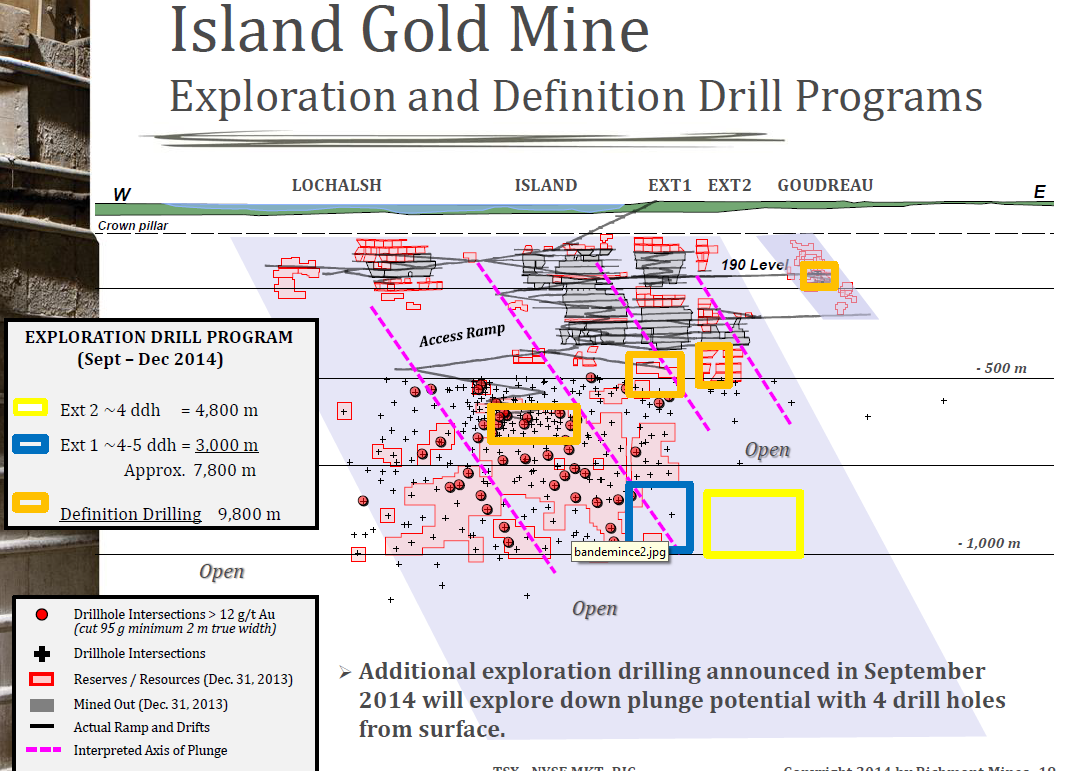
The Island Gold property is 7,168 hectares in size. Mineralization occurs at surface and extends down to at least 1,000 metres. By year end Richmont’s production ramp is expected to extend down to the 660m level. As of December 2013, proven and probable reserves (P+P) were approximately 143,505 ounces… only about three years-worth.
Here’s what gives Island its celebrity, blue skies smiling at me!
Historically speaking, Island Gold has yielded 5.6 g/t (grams per tonne) in the upper portion, good grades, but not great. In prior conference calls management has stated that if we can get grades closer to 7 g/t, cash costs should be in the $700 to $800 range— and lower costs equate to more profits.
Knowing that, you will be able to appreciate why investors are getting excited about Richmont’s “Island Deep”. As drilling moves deeper, grades and vein widths are getting better, potentially a lot better! While there’s still much work to be done, today’s inferred resource shows 1.1 million ounces of gold at 9.6 g/t. Considerably higher than 7 g/t, the magic number that could bring cash costs below $800 per ounce.
Vein widths at Island Deep look to be 4 ½ metres in width, more than 50% larger than the upper portion averaging 2.7 metres vein width.
Island Gold is getting richer at depth. Wider vein widths mean less dilution. Best of all, this material is located immediately below a fully permitted and staffed operating mine.
During Q3 Richmont did about 6,800m of definitional and 3,000m of exploratory drilling at Island Deep. You can expect to see some results before year’s end. Additionally, Richmont is sinking four deep holes (800m to 1,000m length) from surface to test the eastern down-plunge zone. A majority of this data will be included in the updated resource numbers— look for those to be released in January 2015.
Old reliable(s)
While Island Deep gets all the praise, Richmont’s Beaufor mine ain’t too shabby either.
Over its lifetime, Beaufor has bestowed more than 1 million ounces of gold upon the world. It is a relatively low cost operation, cash costs were $949 Cdn ($868 US) in the most recent quarter. While Beaufor’s P+P reserves are underwhelming, it does have more than 300,000 ounces in the indicated and inferred categories. Conservatively, it should have more than five years worth of gold in the ground at current production rates.
My only concern would be that attention is shifting away from Beaufor because its better days are behind it.
Now meet Monique… Richmont’s third mine, an open pit. It too is getting light on reserves. At the moment, Richmont is developing the 350 Zone at Monique, a nearer-to-surface ore body. If all goes according to plan the 350 Zone will move into production as the M-Zone winds down into mid-2015. Approximately 100,000 tonnes of 1.4 g/t material has been stockpiled at Monique for processing at the Camflo mill in 2015.
Well then, we know that Island Deep is the sexier of Richmont’s three mines, but we also know that Beaufor and Monique are contributing roughly 50% of total gold output. Therefore, we’ll need to keep a close eye on the old reliable(s) because they are also paying the bills, and not get swept away with the excitement surrounding Island Deep.
Bottom Line: if +80,000 ounces is to be the new normal for Richmont, Island won’t be able to carry the weight on its own.
Side notes worthy of mention…
- Renaud Adams will be assuming the CEO role effective November 15. He has a technical background (Engineering) with over 20 years of hands on mining experience. Most recently president and COO at Primero Mining.
- Chairman Greg Chamandy owns approx. 12% equity
- Only 3 analysts officially covering the stock
- Richmont has discovered 4 million ounces of gold in the past 4 years at a cost of less than $15 per ounce (total resource base over 5 million ounces)
- Mines located in “mining towns”, employee turnover is minimal, a majority live locally
- Total land package of 14,625 hectares – 14 properties
Production and cost breakdown at each mine year to date:
Island: 184,447 tonnes @ 5.76 g/t – 32,990 ounces poured – cash cost $902 Cdn ($829 US)
Beaufor: 85,326 tonnes @ 6.83 g/t – 18,326 ounces poured – cash cost $949 Cdn ($868 US)
Monique: 184,652 tonnes @ 2.65 g/t – 15,138 ounces poured – cash cost $953 Cdn.
And a few more side notes…
Non-strategic properties offering optionality to higher gold prices
- Wasamac – Measured and Indicated resource of 15 million tonnes at 2.8 g/t (1.3M ounces) and inferred 18 million tonnes at 2.66 g (1.6M ounces) *UG resource, located 15km west of Rouyn-Noranda
- Cripple Creek – intercepts include 16m @ 3.8 g/t and 7m @ 73 g/t… 3-5 g/t intercepts over 500m -1km strike length